 by
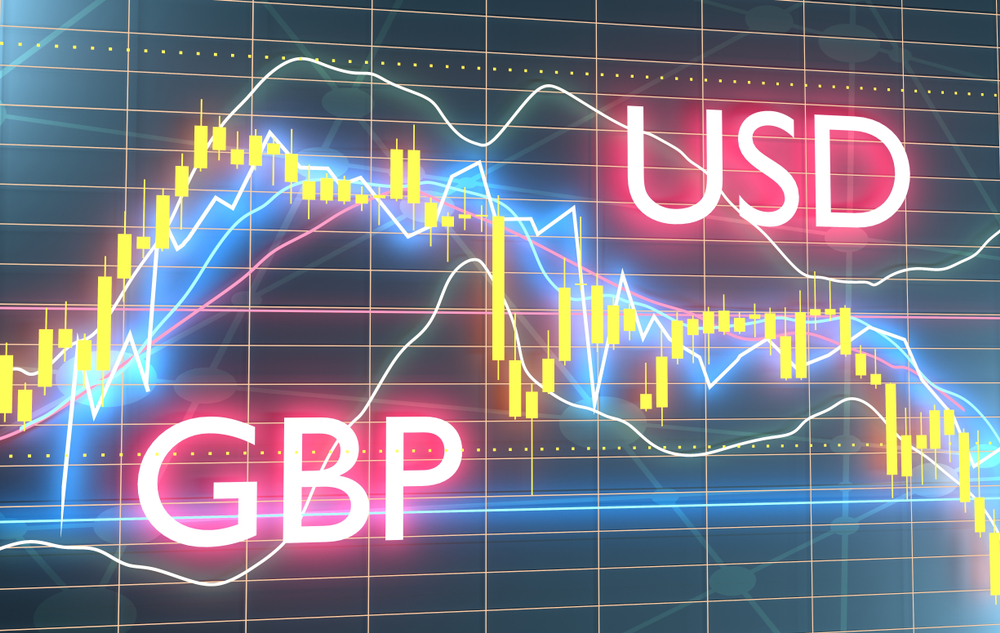
by GBP/USD Pair Declining
On Friday, the GBP/USD currency pair experienced a decline during the American trading session. This drop was triggered by the release of the PCE (Personal Consumption Expenditures) data in the United States, which indicated that inflation had increased more than expected in January 2023.
Specifically, the data showed that inflation had risen to 4.7%, surpassing analysts’ projections of 4.3%. As a result of this unexpected increase in inflation, investors and traders reacted by buying the US dollar, leading to a rally in the currency. This movement caused the GBP/USD exchange rate to drop as the pound weakened against the US dollar.
Technical Analysis
In technical analysis, traders and analysts use various tools to forecast price movements and identify potential entry and exit points for trades. In the case of the GBP/USD currency pair, several technical indicators suggest both potential resistance and support levels.
Firstly, the Relative Strength Index (RSI) currently shows a neutral bias for the pair in the long term. The RSI indicates the momentum of the strength of price movements over a particular period.
An RSI reading below 50 is usually interpreted as a bearish signal, while a reading above 50 is considered bullish. However, the RSI for the GBP/USD pair has been moving sideways below 50, indicating a lack of strong directional momentum.
On the upside, the pair faces significant resistance at the 1.2070 level. This level is the confluence of the 20-day Simple Moving Average (SMA), Fibonacci 62%, and 50-day SMA. Traders and analysts widely follow these three technical indicators, and their alignment at this level suggests it is a strong resistance area.
However, if the pair can close above this level, it could attract bulls, leading to an extended recovery toward the 1.2100 and 1.2140 levels. Conversely, the GBP/USD pair has immediate support at the static level of 1.2000.
This level has been a crucial support area in the past, and a break below it could lead to further downside movement. Furthermore, if the pair drops below 1.1960, analysts expect a similar action to the last time it happened, leading to new weekly lows.
In recent trading sessions, the GBP/USD pair has been consolidating above the critical support level of 1.2000. This consolidation has led to the formation of a short-term movement range between 1.2000 and 1.2070.
A close outside these parameters could trigger the next directional move for the pair. Therefore, traders and analysts closely watch breakout or breakdown signals to adjust their trading strategies accordingly.
On Friday, the financial markets remained mixed, with the GBP/USD pair trading above the 1.2000 level. The FTSE 100 was up by 0.3%, indicating bullish market sentiment. However, US stocks opened lower, with losses ranging from 0.2% to 0.6%.
The mixed market sentiment is likely due to Personal Consumption Expenditures (PCE) release data in the US, which showed higher-than-expected inflation, leading to a rally in the US dollar. The market’s reaction to the PCE data highlights the importance of economic indicators in forex trading.
Traders and investors closely monitor economic indicators like inflation, GDP, and employment data to gauge the health of an economy and make informed trading decisions. For example, higher-than-expected inflation can lead to a strengthening of the currency and vice versa.