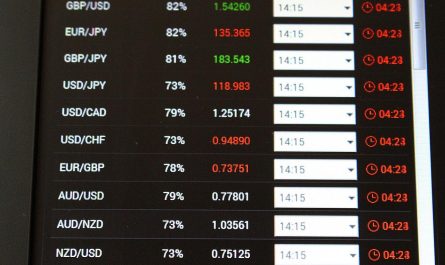
The NZD faced a steep decline in value on Monday in response to positive U.S. jobs data released end of last week by the government. The robust labor market data has fueled concerns about potential interest rate increases by the FED.
The central bank indicated that a sturdy labor market could usher in excessive earnings growth and inflation coercion. Currently, at the time of press, the New Zealand Dollar is trading at 0.6302, down 0.38%.
The Kiwi suffered a significant drop last Friday as the release of sturdy U.S. jobs data led to a rise in U.S. bond yields, which revived concerns about the FED’s interest rate stance. In addition, the unexpected surge in U.S. NFP or Non-farm payroll employment, with a gain of 517k jobs last month compared to the expected increase of 185k jobs, caused the unemployment rate to fall to a multi-year low of 3.3%.
This sudden development has caused traders to change their position, now betting that the FED could keep the interest rates higher for a lengthier time without causing a recession in the world’s largest economy.
This outlook is a key shift from their previous belief that the Fed would end its aggressive rate hikes in March. These developments significantly impact the Kiwi’s value, causing it to decline in response to the shifting monetary policy expectations.
Technical Analysis
According to the technical analysis, the NZD/USD currency pair is trending upwards, as seen on the daily fluctuation chart. Despite this, the pace of the trend has been slowing down, indicating that the currency pair’s price is rising slowly.
A trade above .6538 suggests the upward trend will persist, while a trade below .6191 would signify a shift to a downward trend. The current short-period range for the currency pair is between .6191 and .6538. The pair is trading below its 50% resistance level at .6360.
The next resistance level is the 50% long-term level at .6467level at .6467 on the upside, while the next support level on the downside is the Fibonacci long-term level at .6231. This aspect will help investors and traders closely monitor these levels to predict the future price movements of the currency pair.
As we delve deeper into the analysis, it’s important to remember that the near-term 50 points level at .6360 acts as a crucial pivot point for the currency pair. As a result, the price movement beyond this level will significantly impact the pair’s direction in the coming days.
Bearish Signal
Traders will closely monitor the price action around the .6365 level to determine the strength of either the buyers or the sellers. If the price falls below .6364, it will be a bearish signal, and traders may look to short the pair.
In such a scenario, the price may head towards the Fibonacci long-term level at .6230, allowing traders to exit with profits.
Bullish Signals
Conversely, if the price holds above .6365, it will be a bullish signal, indicating the buyers’ presence in the market. In this case, the pair may head toward the pivot at .6415 and the long-term 50 points at .6469, providing a buying opportunity for traders.
In conclusion, the direction of the NZD/USD will depend on the price action around the crucial pivot point of .6365. Traders will closely monitor this level to determine the strength of either the buyers or the sellers and position themselves accordingly.


